QGIS MGP Plugin
Install the QGIS MGP Plugin to bring georeferenced high-resolution satellite imagery, Vivid Basemaps, and Analytics into your GIS project using OGC-compliant web services. This plugin requires valid MGP account credentials.
- Latest version: 1.4.1
- Filename:
MGP_QGIS_1.4.1.zip - QGIS Requirement: QGIS version 3.22 or higher. If you need to install QGIS, download it from https://qgis.org
What's new in 1.4.1
- Worldview Legion 5 and 6 imagery is now available for streaming and has been added to filters.
- Projects can now get all projects instead of the first 20 projects.--------------------------------------------------
Download the MGP QGIS Plugin
Download the MGP QGIS Plugin zip file
Open a QGIS Project
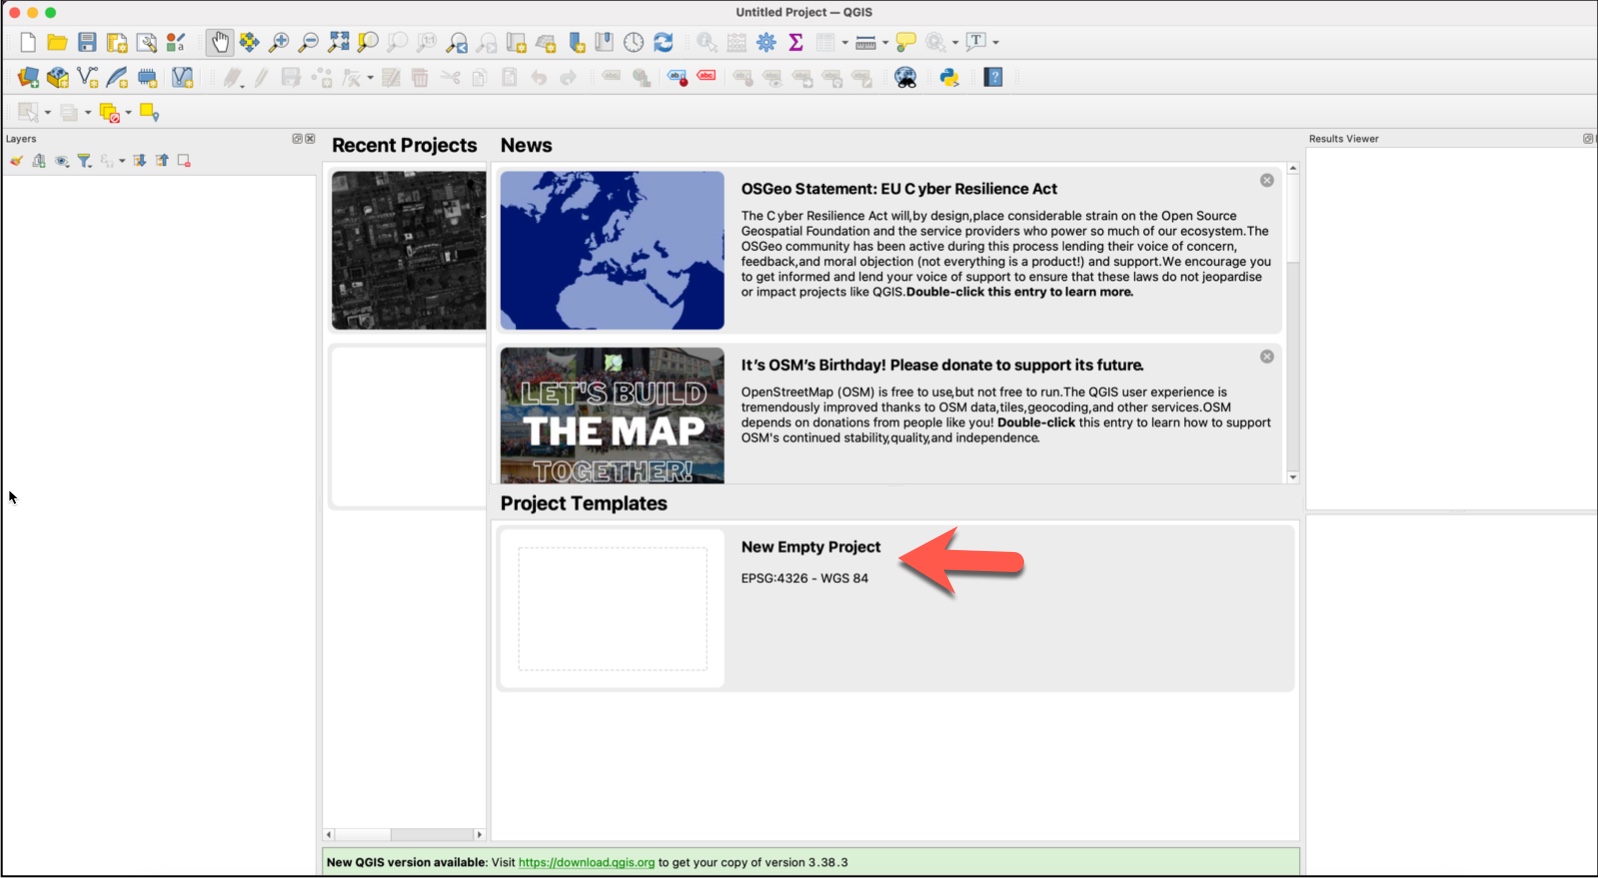
- Open QGIS.
- Open an existing project or select "New Empty Project."
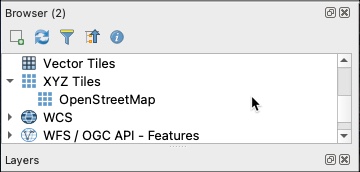
- Add a basemap (optional).
Adding a basemap to the project will help you orient to the location you want to work with. The Open Street Maps basemap is available to any project, and additional basemaps can be added.
To select a basemap:
- From the "browser" panel on the left pane, select XYZ Tiles.
- Select Open Street Map or any other basemap in your list.
- If you don't see the "browser" pane, from the top navigation choose View > Panels > Browser.
Install the QGIS MGP Plugin
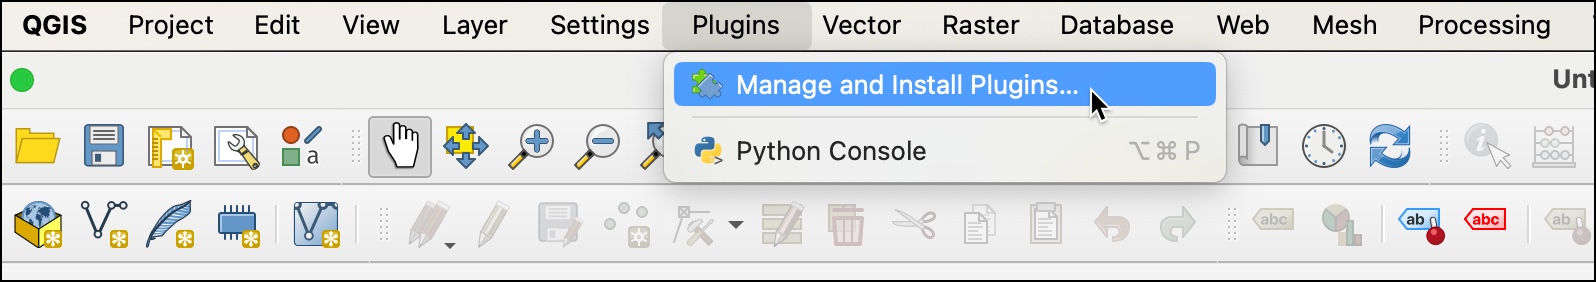
- In QGIS, select "Plugins" from the top navigation bar, then select "Manage and Install Plugins."
- From the Plugins menu page, select "Install from ZIP."
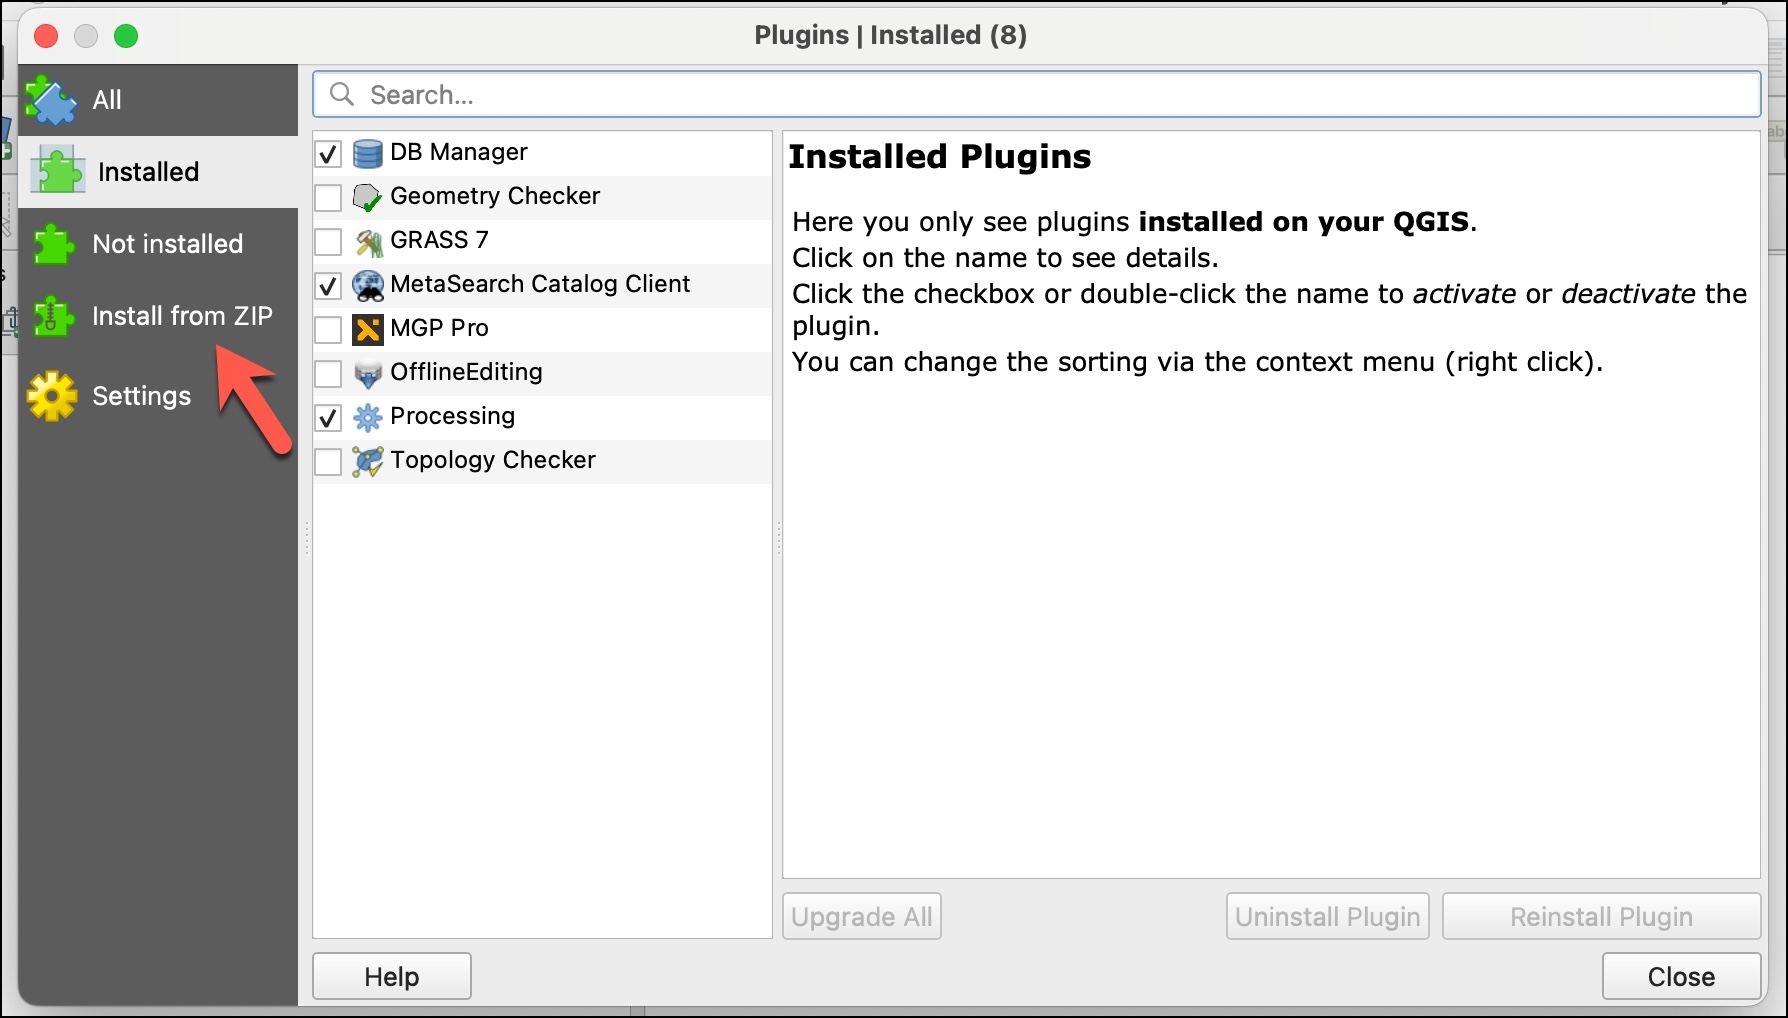
- Upload the zip file from the download location on your local drive.
After you install the MGP QGIS plugin, the MGP toolbar will appear. All icons except the Maxar icon will be grayed out at first because you are not logged in.
Log in to the MGP Plugin
-
Select the Maxar icon on the MGP toolbar to open the login screen.
-
Sign in with your MGP username (email address) and password.
-
The "username" box on the login screen will display "logged in as [your username]." QGIS may also prompt you to enter your QGIS "master password" at this time.
Note: If you have forgotten your MGP password, you can reset it by choosing "forgot password." This will change the password for your MGP account.
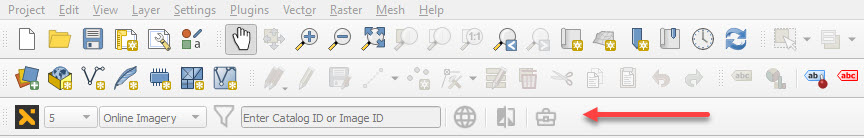
Navigate using the MGP toolbar
When you are logged in to the MGP Plugin, the icons on the tool bar will be bold. This is a simple way to tell if you are logged in or not. If you're not logged in, the icons will be grayed out.
The numbers on the following image correspond to the numbered descriptions below it.
![]()
| Icon Number | Description | Default Value |
|---|---|---|
| 1 | Select to log out of the add-in. | N/A |
| 2 | Select the number of images shown in the sidebar after filtering is applied. | 5 |
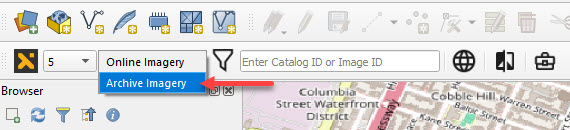
| 3 | Select "Online Imagery" or "Archive Imagery." Online and archive imagery may have different metadata fields. | "Online Imagery" |
| 4 | Select filter parameters to apply to your imagery search. | All off |
| 5 | Input a Catalog ID or Image ID to search for a specific image. | N/A |
| 6 | Adds a "Vivid Standard" and a "Vivid Advanced" layer to your sidebar. | All off |
| 7 | Select "Change Monitoring" (CM) and "FirstLook" layers. | All off |
| 8 | Select a project to load into QGIS. | No project selected |
When you are logged in, you can zoom in to any location on Earth to see imagery or Vivid basemaps. You can also apply filters to further refine imagery results.
Maxar Online Imagery
Once you are logged in, you can zoom in to any location to see "Maxar Online Imagery." You can also apply filters to further refine imagery results. "Maxar Online Imagery" will appear on the left panel. When "Maxar Online Imagery" is selected, the QGIS MGP add-in offers the following content and capabilities:
- Shows the most recent imagery (image strips) available when you are zoomed in below 1:50,000.
- Lets you select and view imagery and filter the results.
- Displays metadata for a selected image within Table of Contents.
- Lets you exploit imagery to fit different needs.
Selecting imagery
The "Maxar Online Imagery" menu item will not appear until you zoom in to an extent below 1:50,000. Once you are zoomed in, the "Maxar Online Imagery" menu item will appear and imagery for the area you are zoomed in to will appear under the menu item.
Check the box next to one or more images from the list to view them on the map.
Imagery filters
Choose the "Filter" option from the MGP toolbar to open the "Imagery Filters" panel. Check the box next to the filter options you want to set and then set the filter values. Closing the filter form sets all your imagery filters back to the defaults. If you want the filters to persist, minimize the filter panel instead of closing it.
The following filters can be applied for image strips:

| Filter name | Description | Allowed values |
|---|---|---|
| Acquisition Date | Use the calendar picker to filter for acquisitions (image strips) captured by the satellite between the specified start and end date, inclusive. | Start date and End date must be set to the current date or earlier. |
| Time of Day | Use the Time of Day picker to filter for acquisitions (image strips) captured by the satellite between the specific start and end time in local time of the region captured, inclusive. | 00:00:00 - 23:59:59 |
| Cloud Cover | Filter for imagery at or below the specified maximum cloud cover percentage. | 1% - 100%. |
| Off Nadir Angle | Filter for imagery with an off nadir angle between the specified minimum and maximum values, inclusive. | Allowed values for both minimum and maximum are 0-60 degrees. |
| Sun Elevation Angle | Filter for imagery by Sun Elevation Angle. | 1%-100%. |
| Sensor | Filter by selected sensor(s). Multiple sensors can be selected. | GE01, WV01, WV02, WV03_VNIR, WV04, LG01, LG02, LG03, LG04, LG05, LG06. |
Click the "apply" button and imagery that matches your location and filter criteria will populate the Maxar Imagery list.
Exploiting imagery (Raster Analytics)
Maxar imagery collected since the beginning of 2024 is "exploitable." Some imagery collected prior to 2024 is also available to exploit. When an image is exploited, additional processing such as Atmospheric Compensation and High-definition (HD) can be applied. Dynamic Range Adjustment (DRA) is on by default but can be turned off. Bands can be manipulated to create false-color composites on the fly. Exploited images are added to the Raster Analytics layer.
To manipulate an image using Exploit mode:
-
Select an image you want to exploit. To find exploitable imagery, you can use the date range filter to return imagery collected in 2024. Only one image can be exploited at a time.
-
Right-click on the image, then select "exploit image" from the bottom of the menu.

This will bring up the "Exploit Imagery" window.
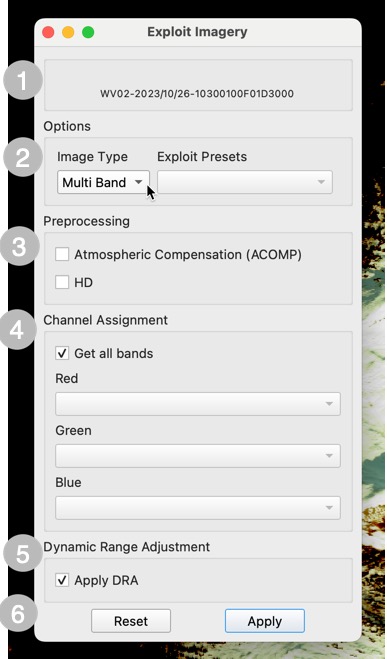
The numbers in the left-hand column of the table correspond to the numbers in the image.
| Menu Item | Description | |
|---|---|---|
| 1 | Image Name | The image name is comprised of the sensor that collected the image, the date of collection, and the image ID. |
| 2 | Options | The options in this section are Image Type and Exploit Presets. Image Type for a WorldView-1 image is "Pan." For all other sensors "Multi band" and "Pan" options are available. See below for Exploit Presets by sensor. |
| 3 | Preprocessing | Pre-processing options are "Atmospheric Compensation (AComp)" and "HD". HD is unavailable for LG06 imagery. |
| 4 | Channel Assignment | Channel assignment band values are set when an Exploit Preset option is selected. Values can be changed by selecting from the drop down menu for the channel. If no Exploit Presets are available, select bands from each of the drop down menus. |
| 5 | Dynamic Range Adjustment | DRA is applied by default. Uncheck the box to remove it from processing steps. |
| 6 | Reset, Apply | Once exploit selections have been made, click "Apply" to apply selections to the image, click "Reset" to set band values back to their defaults. |
Exploit Presets
Exploit presets are available for WorldView-2 and WorldView-3 imagery. This table shows the exploit form settings and the values for each preset type. You can change the values for each channel by opening the dropdown menu for the channel and choosing a band.
| Channel Assignment | Vegetation | Enhanced Color Infrared | Bathymetry |
|---|---|---|---|
| Red channel | nir2 | nir2 | green |
| Green channel | yellow | red_edge | blue |
| Blue channel | coastal | green | coastal |
Get all bands
With exploit mode, you can request a raster image with all available bands. This image will appear in the "Raster Analytics" layer, with "Exploit" appended to the image ID. From the exploited image, you can go to the layer properties to manipulate the bands and apply the changes.
-
From the selected image in the Maxar Imagery layer, right click and select "Exploit Image."
-
From the Exploit menu, select "All bands" and apply your selection.
-
Find the exploited image in the Raster Analytics layer.
-
Right click the image name and choose "properties."
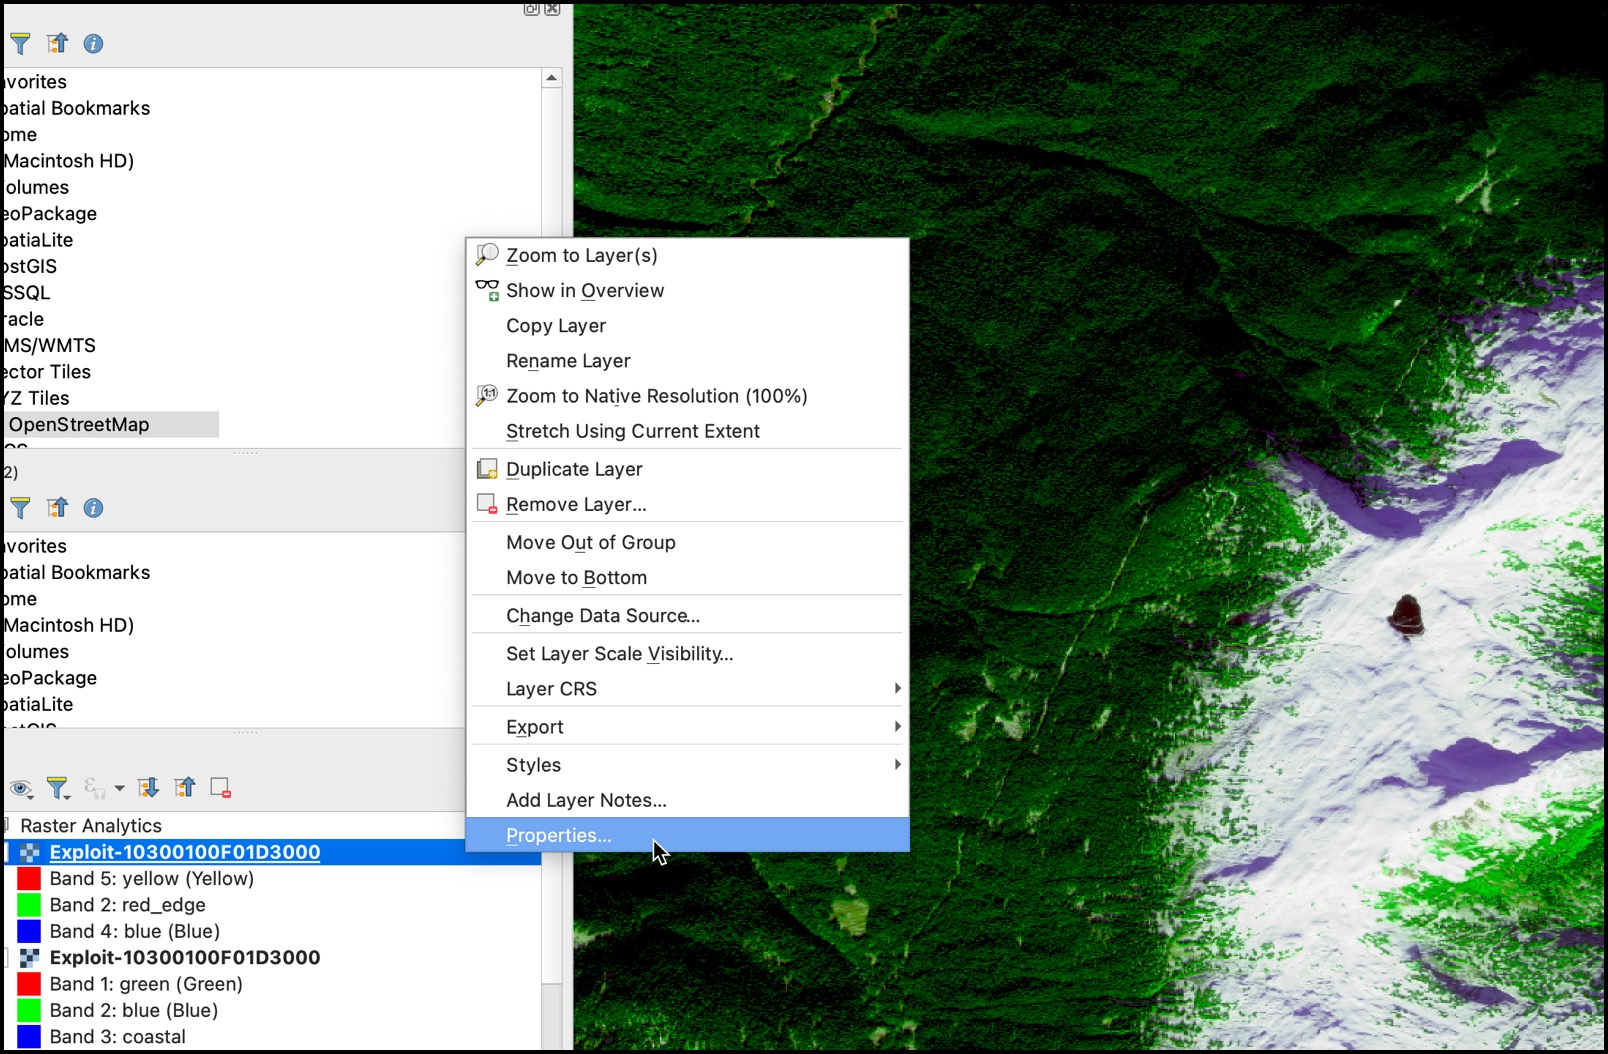
-
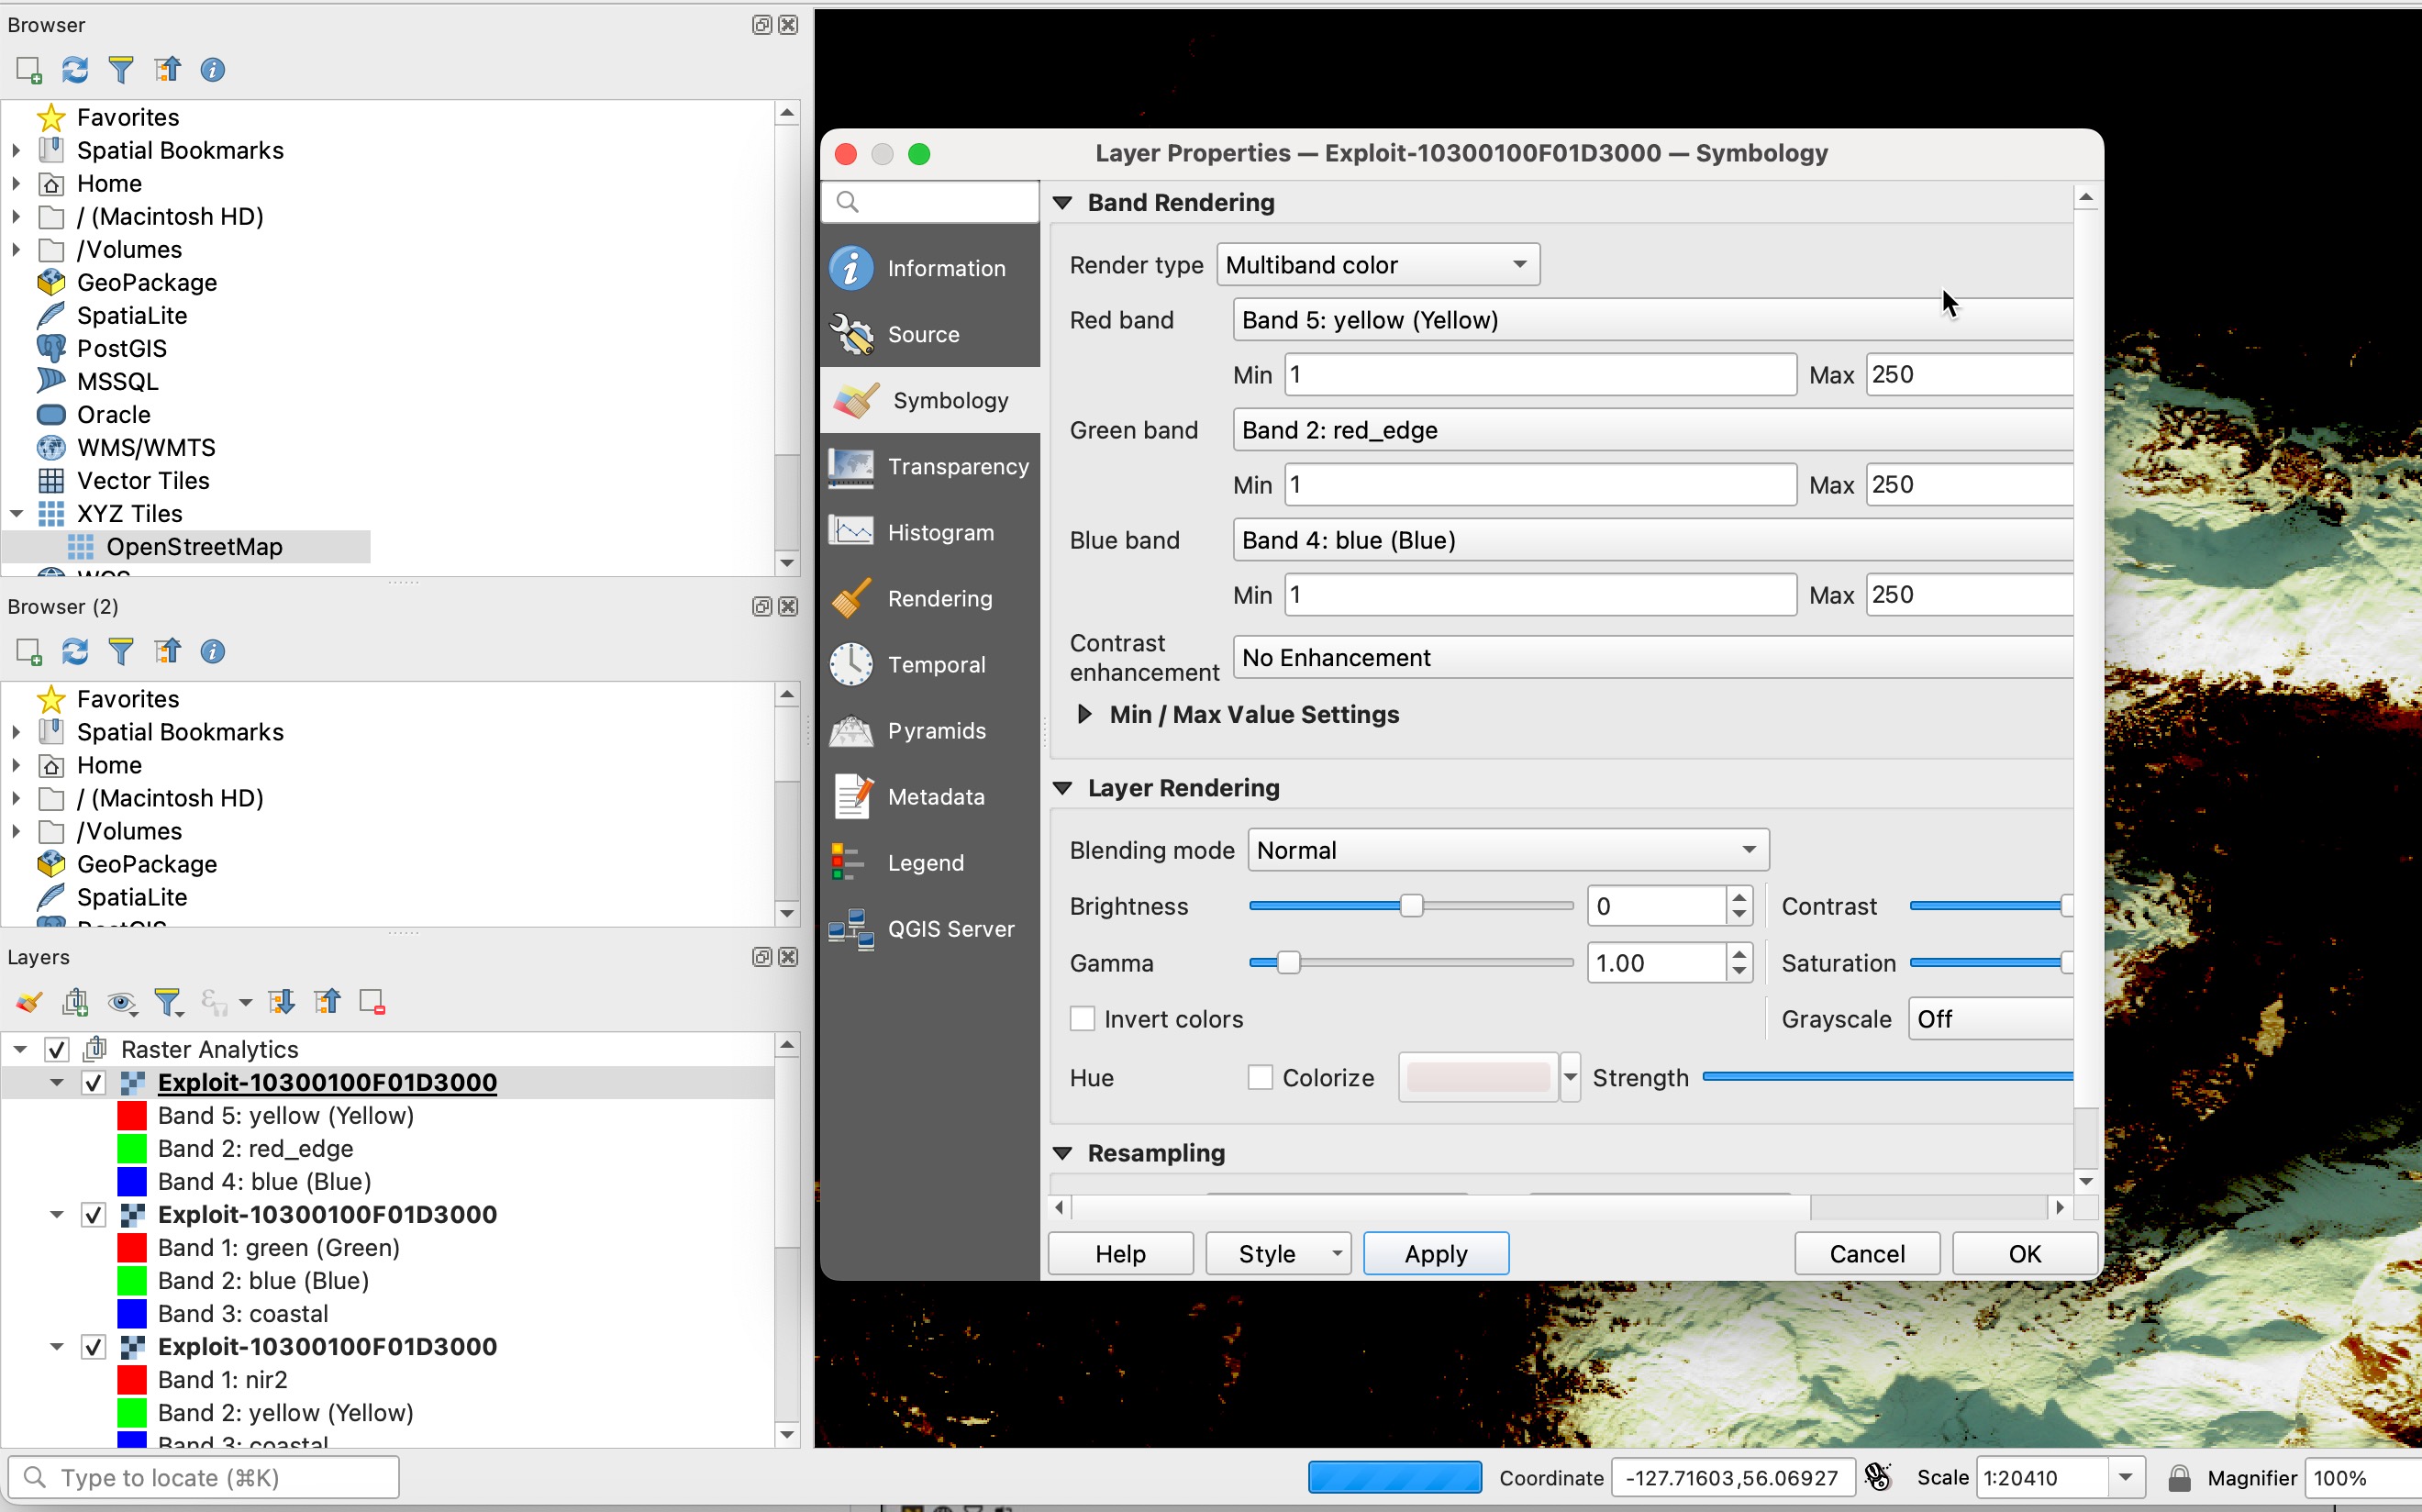
From the layer properties, choose "symbology."
-
From the symbology menu, change the band values and apply your changes.
Closing the Exploit form
Closing the form does not remove the layer, but the map will not be redrawn. You can view the static map tile on the map.
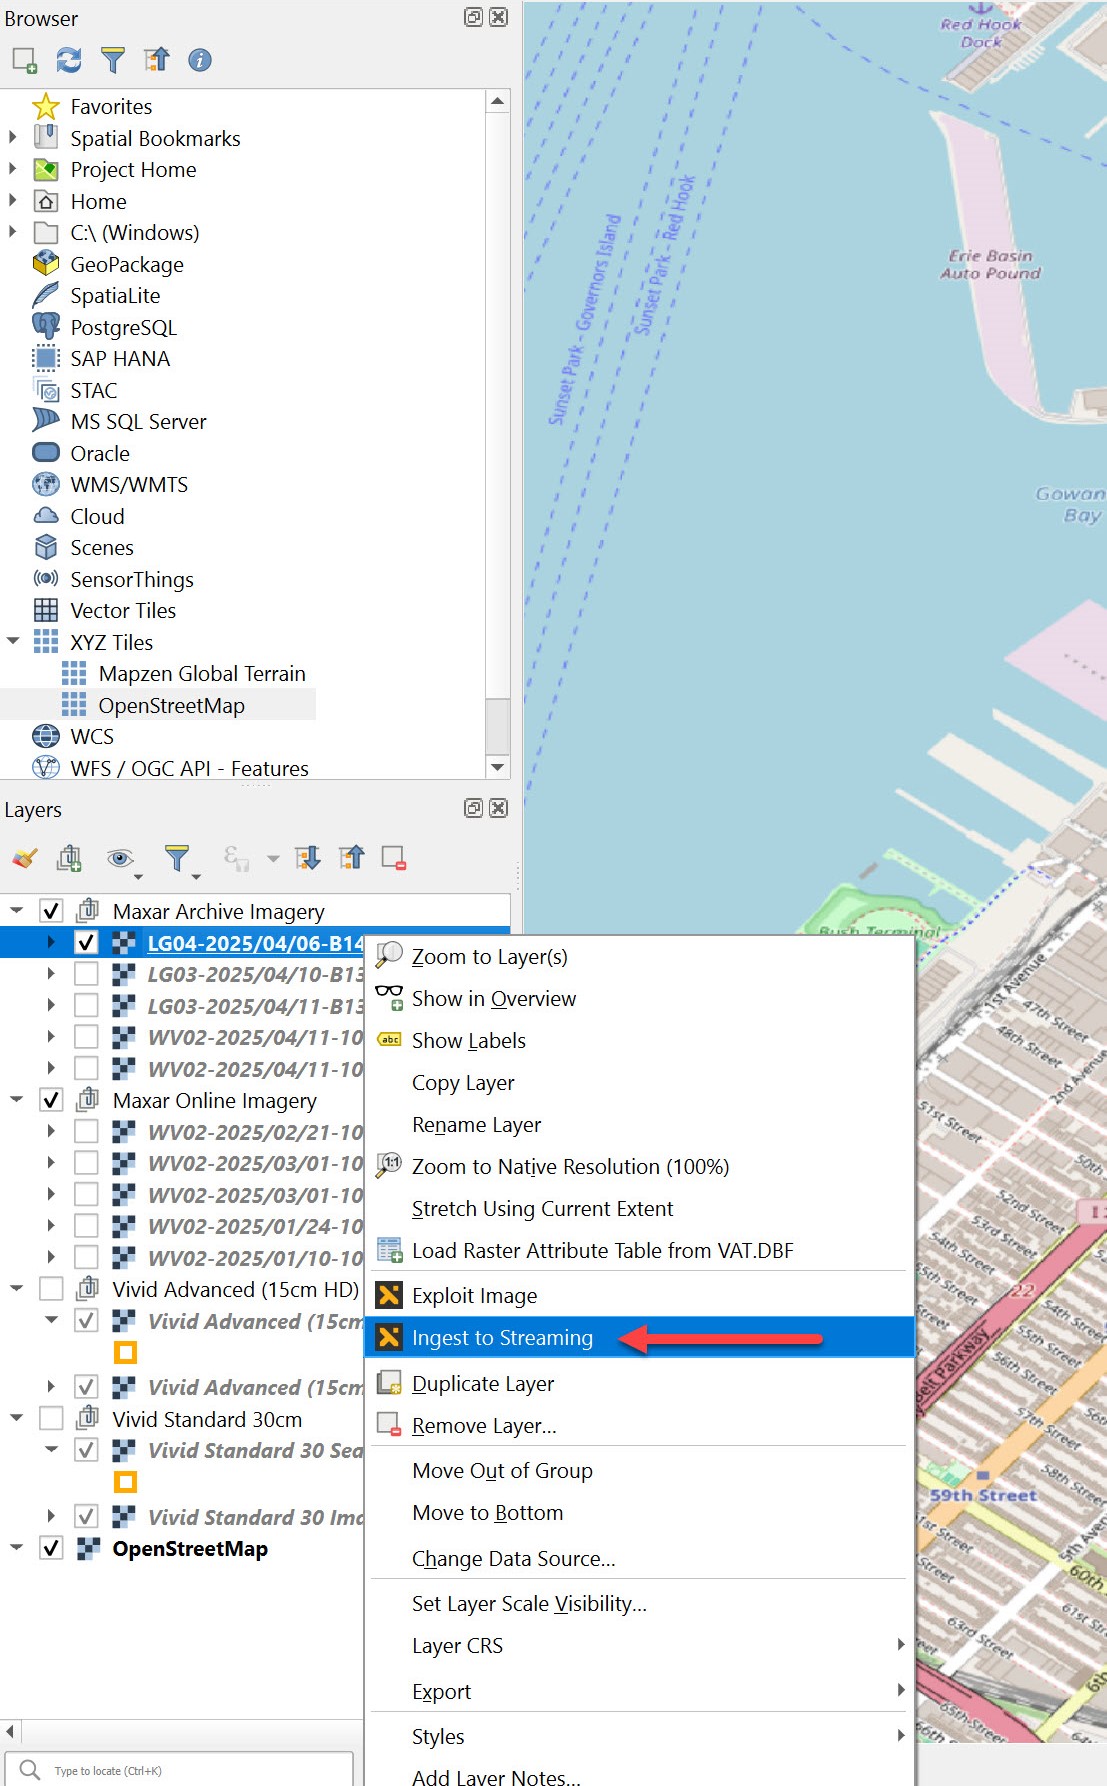
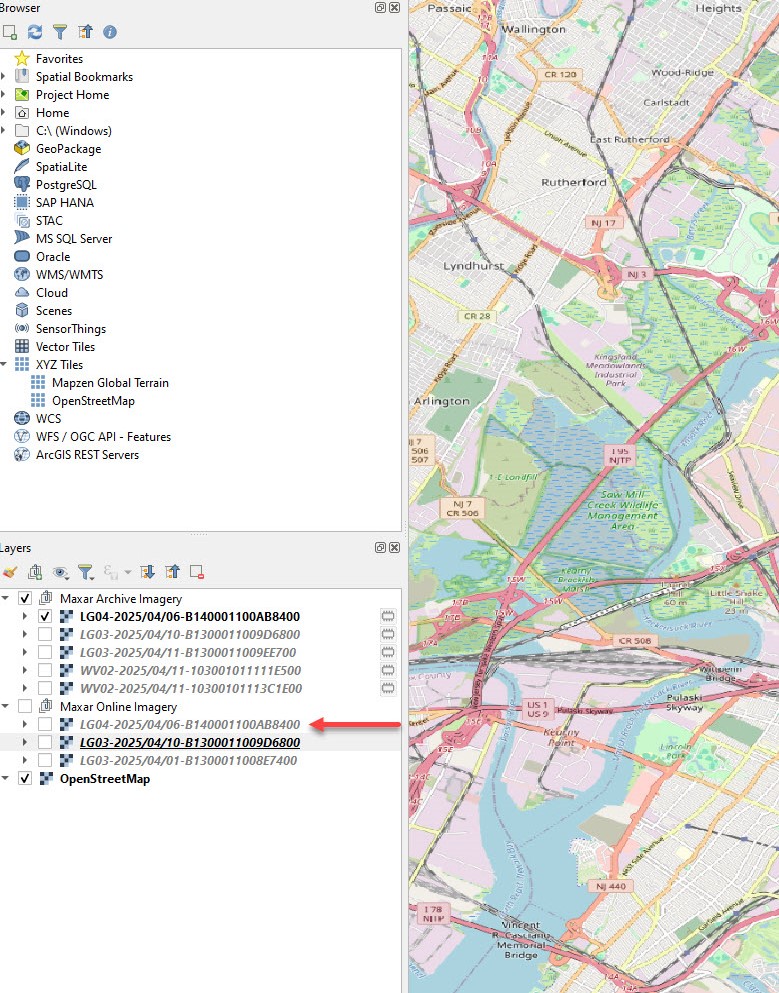
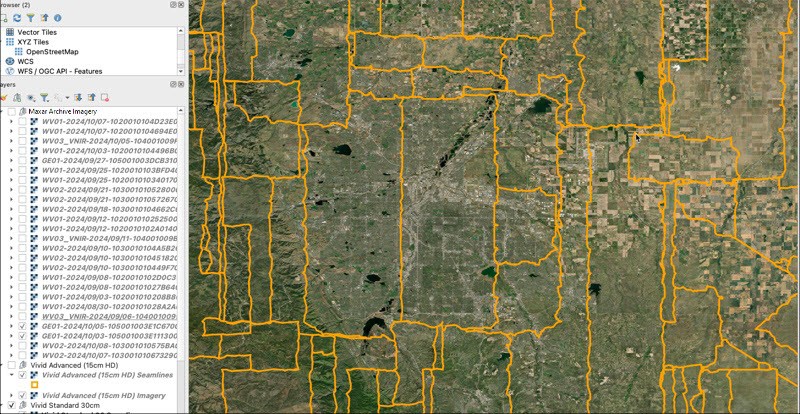
Maxar Archive Imagery
To view archive imagery, navigate to the "Image Search Type" dropdown in the toolbar and select "Archive Imagery." Once this is selected, you will see an additional group layer called "Maxar Archive Imagery" in your sidebar. Deselect the "Maxar Online Imagery" group layer and make sure "Maxar Archive Imagery" is selected to view archive imagery.
Ingest to Streaming
Note: This feature is only available for "Maxar Archive Imagery."
"Ingest to Streaming" is the process of making an archive image available for streaming. During this process, an image is ordered from the archive catalog and ingested to the online catalog. To ingest an image, right click on the desired archive image and select "Ingest to Streaming."
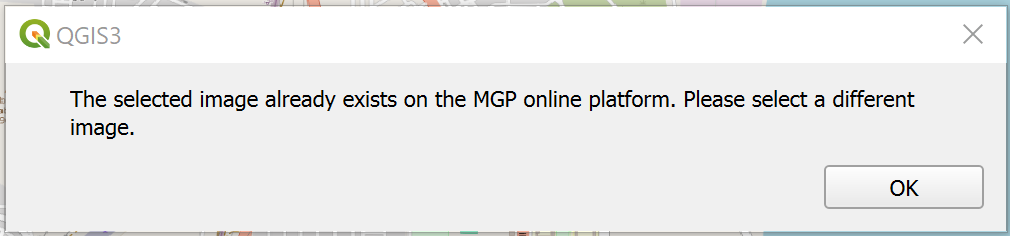
If the image already exists in the online catalog, the dialog box below will appear.
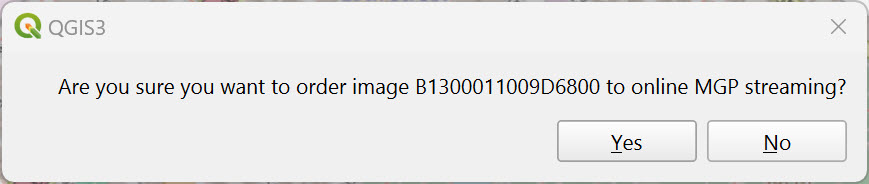
A dialog will confirm your order. After confirming your order, your request will be processed and a dialog box will inform you that your order was successfully placed.

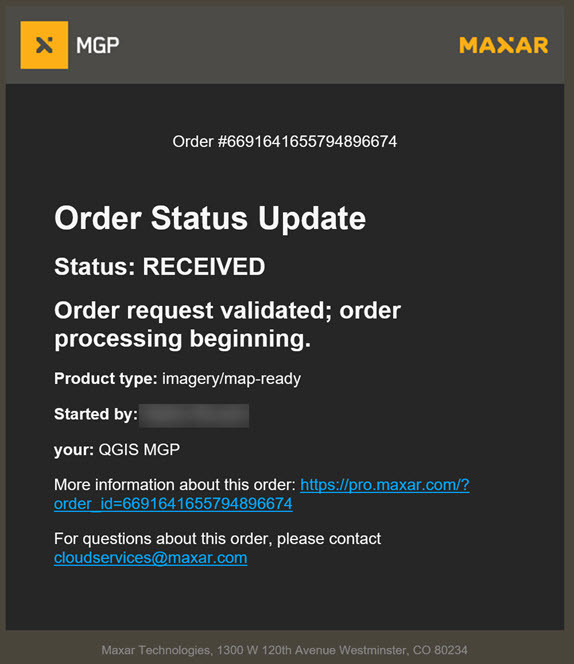
Once your order has been received, you will receive an email with an order status of "RECEIVED."
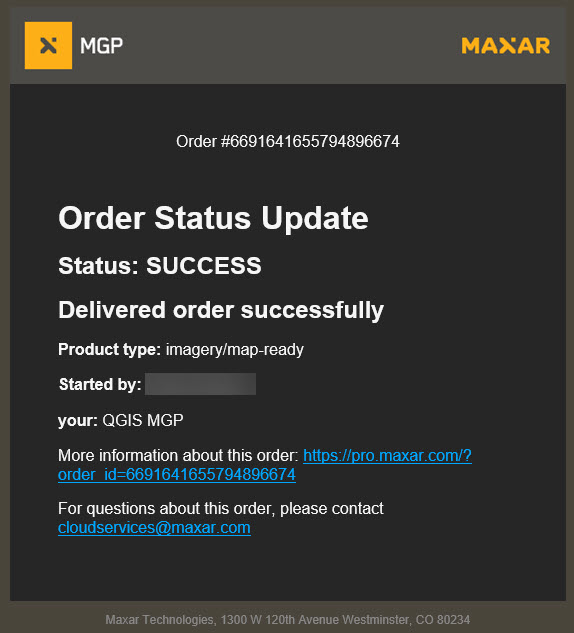
Once your order has been processed, you will receive an email with an order status of "SUCCESS."
After your order is successfully processed, move your view window in QGIS slightly or select the refresh button in the lower right corner and the newly ingested image will appear in your "Maxar Online Imagery" group layer. This image is ingested to a private layer that is only available to your MGP account.
Search for a specific image.
You can search for specific Online or Archive imagery. To search for a specific Online image, input an image's Image ID in the "Single Image Search" box. To search for a specific Archive image, input an image's Catalog ID in the "Single Image Search" box. The image will appear as a layer in the left panel. QGIS will automatically zoom to that image's extent.
Vivid basemaps and seamlines
Select the "Vivid Basemaps and Seamlines" icon from the toolbar. The icon is located next to right of the Maxar icon.
All Vivid Basemap product layers will populate the layers panel.
To select a Vivid basemap layer, select if from the layers panel and deselect Maxar Imagery. Vivid basemaps are available (most recent production block pixels) for the following products:
| Vivid basemap product | Description |
|---|---|
| Vivid Advanced 15 cm HD | An imagery basemap with 15 cm HD Product GSD and 5m CE90 accuracy, plus committed image currency and advanced aesthetics, including minimal clouds and shear. Vivid Advanced 15 is only available for select cities. |
| Vivid Standard 30 cm HD | A global imagery basemap with 30 cm HD Product GSD and 5m CE90 accuracy, and includes the most recent imagery available that provides a high quality, clear view of the ground. |
Note: If you don't see the selected Vivid basemap displayed on the map, make sure you have unchecked Maxar imagery.
Vivid basemaps can be viewed with or without seamlines.

Viewing Basemap metadata
To view the metadata for the basemap or seamlines, select the QGIS "identify" tool from the top navigation bar.
Enabling seamlines
To view seamlines for a Vivid basemap, check the box next to seamlines for the Vivid product you are viewing. Seamlines won't display if you're zoomed in too close. Zoom out until you see yellow seamlines and continue to zoom out as needed.
Change Monitoring (CM)
To view CM data, choose the Analytics icon from the toolbar, then choose one or more CM layers from the menu. The top level cm layers are listed by year.
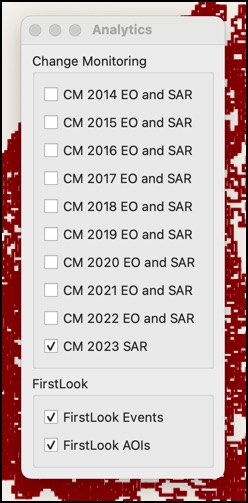
Expand the CM layer menu item in the left pane to see the specific CM types available. For example, under CM 2022, expand the menu and select CM EO 2022 and CM SAR 2022.
Select the QGIS "Identify" tool from the top menu.
Click inside a polygon to view its metadata.
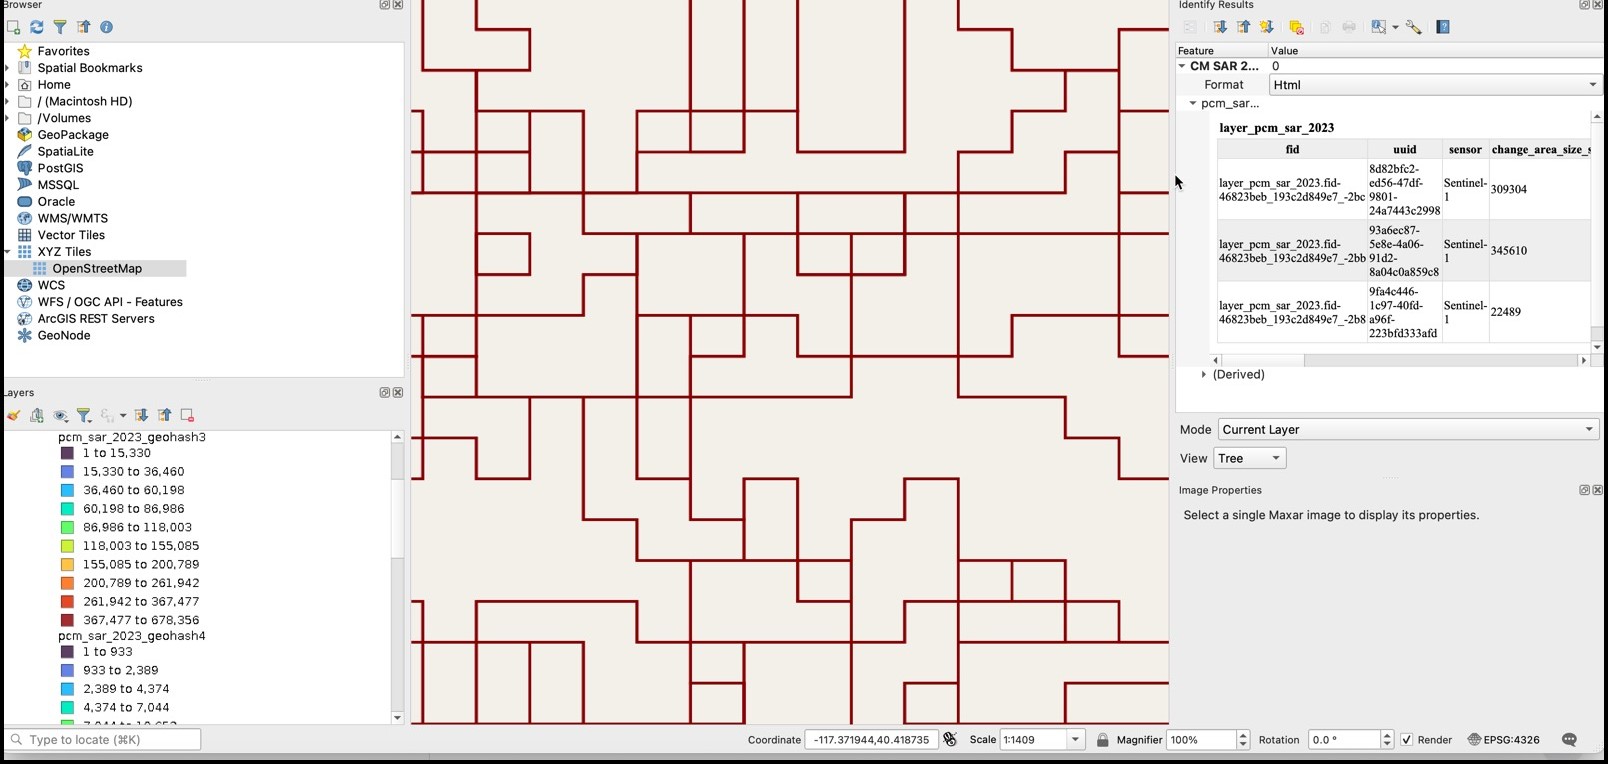
Polygons are best viewed at lower zoom levels. Zoom levels higher than 50000 will return heatmap tiles.
Hint: When viewing properties, change the view from "html" to "feature" to see the data displayed in feature format.
FirstLook Events and AOIs
FirstLook Events and AOI layers are available in the QGIS plugin. The layer includes events for the past year.
To view FirstLook data:
- Choose the Analytics icon from the toolbar, then choose from the FirstLook Events and FirstLook AOIs layers from the menu. The menu is pictured in the previous section, Change Monitoring. Firstlook events can be seen at any zoom level.
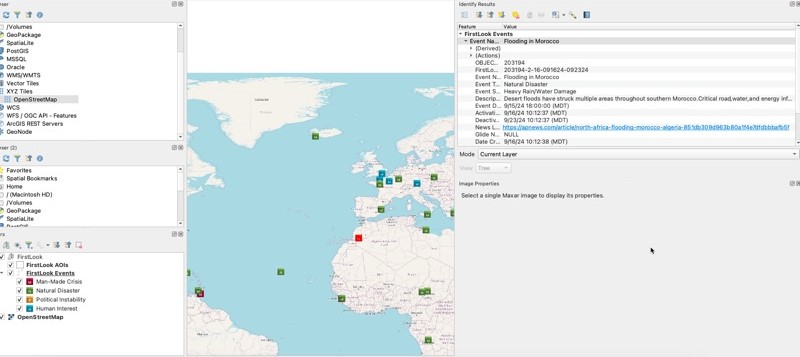
- Expand the FirstLook layer menu item in the left pane to see the event types color legend.
To view the metadata for an event, select the "identify" icon from the top navigation menu and click an event. The metadata will appear in the right pane. The image above shows metadata for an event titled "Flooding in Morocco."
To see a list of events and their attributes, "right-click" the label "FirstLook Events" in the layers pane, then choose "open attribute table."
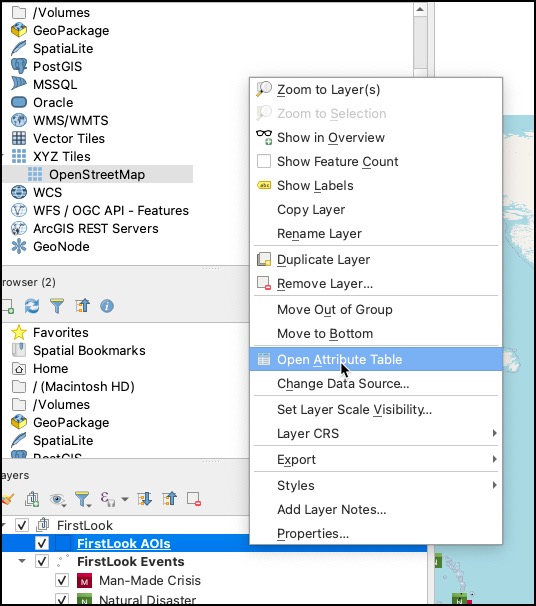
This will bring up a list of events and their attributes in a table format. The menu bar on the table provides, filtering, sorting, and organizing options. For example, you can click on a column to sort by its values, or select the "organize columns" button in the toolbar to better organize and sort the data.
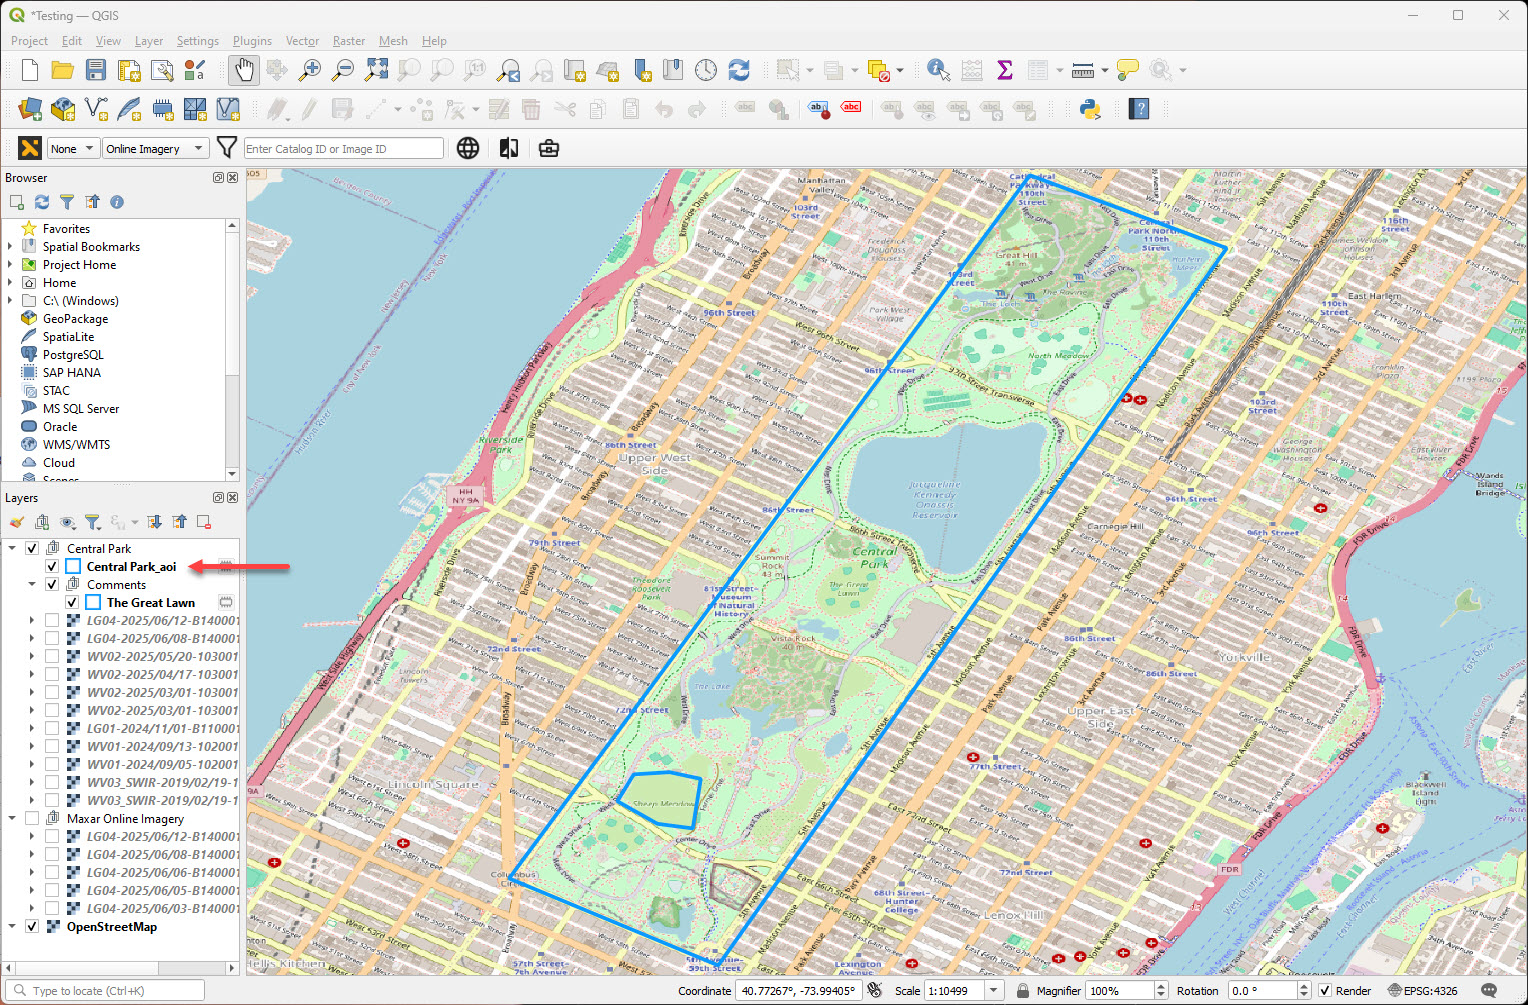
Projects
See MGP UI Projects.
A Project is a saved AOI and imagery that are accessible by everyone on your account. Projects allow for collaboration across multiple users. Once a project has been created and published in the MGP UI (see Projects), it will display in QGIS.
- Select the "Projects" icon on the toolbar. A pop-up opens with all published projects associated with your account.
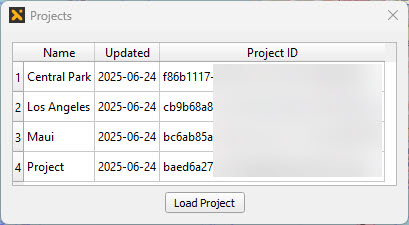
- Select the project you want to load and select "Load Project". You can load multiple projects.
Note: This sets your "Images to Show" value for streaming Online Imagery to "None" and removes the "Maxar Online Imagery" and "Maxar Archive Imagery" layers from the sidebar. To re-enable streaming imagery, set the "Images to Show" Value to anything other than "None".
Possible errors
| Image | Error |
|---|---|
 | Your project is already open in QGIS. |
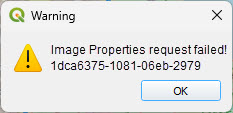 | You do not have the proper permissions to load selected imagery. |
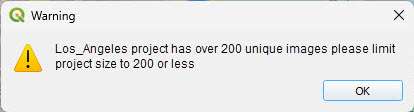 | There are too many images in this project to load. |
 | There are no images in this project. |
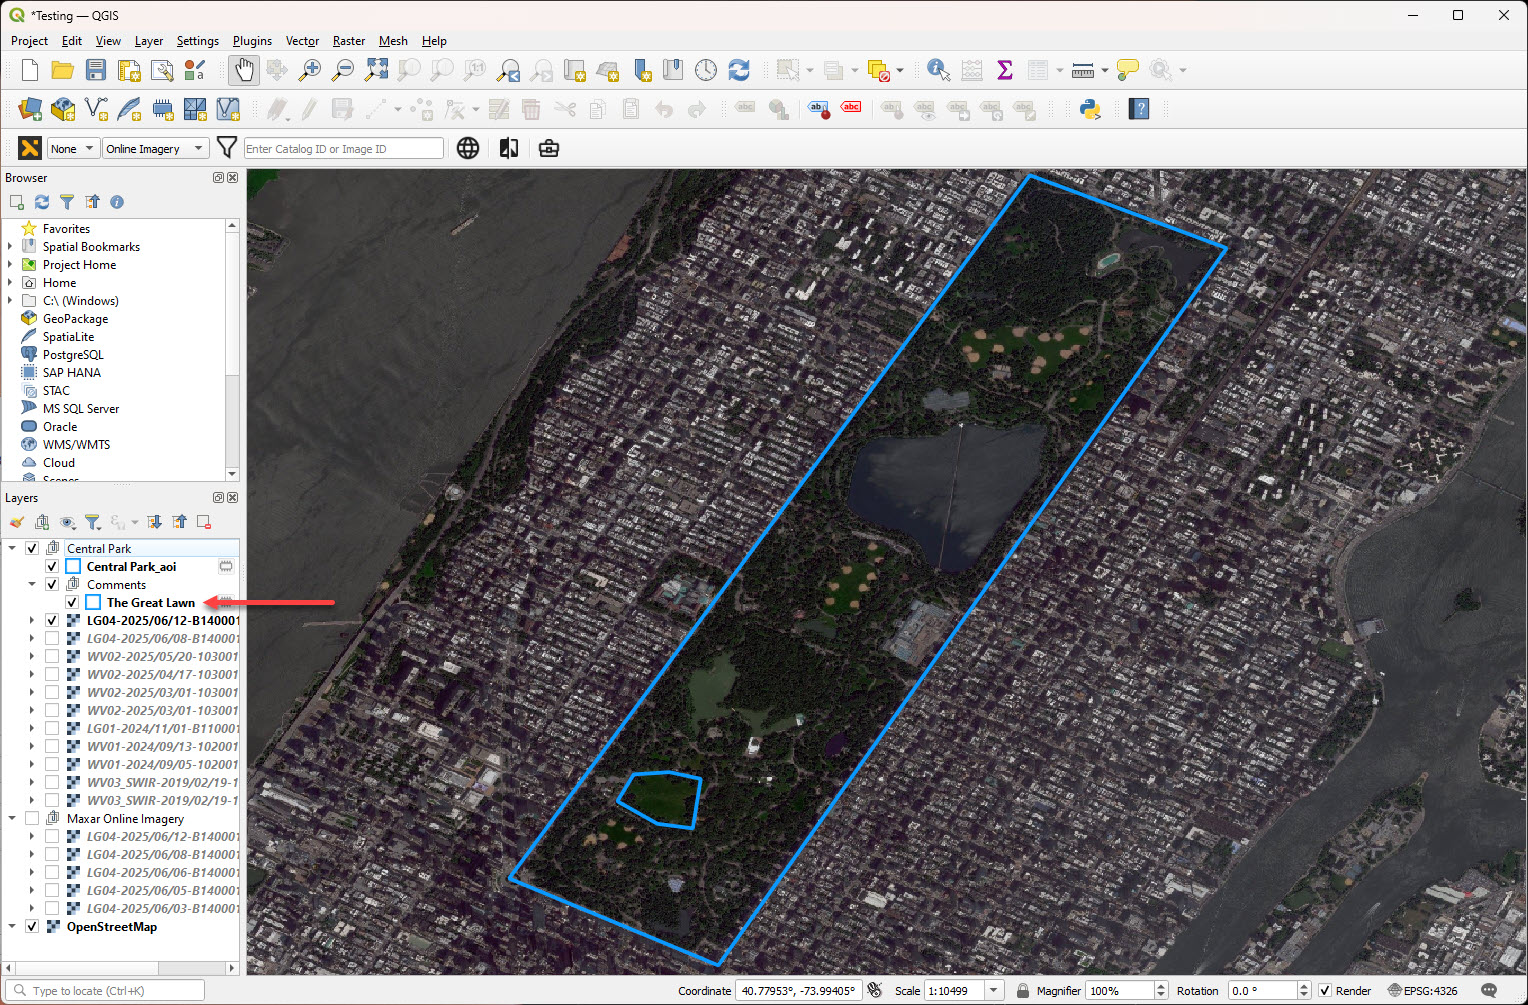
- Your project loads as a layer. QGIS automatically zooms to your project's AOI and the AOI will appear as a blue outline.
- To display your project's imagery, select the checkbox next to imagery in your project's layer.

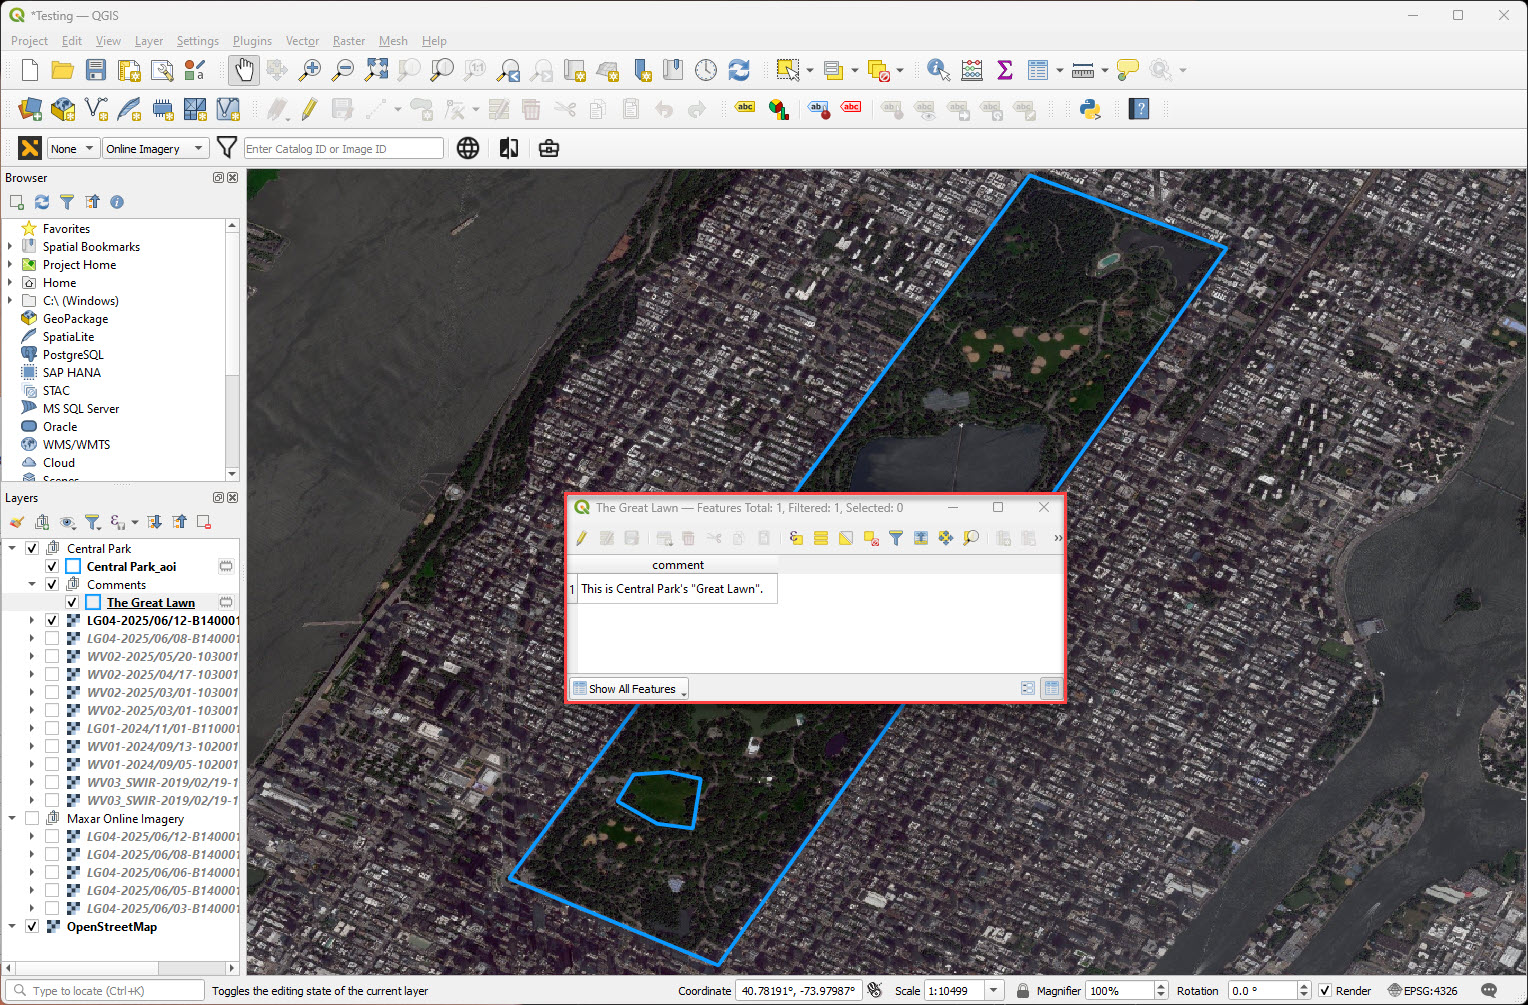
Comments
See MGP UI Comments.
Comments created in projects within the MGP UI load within the Comments layer. They have the same symbology as in the UI and have the name CommentName.
To view the text of a comment, right click on the comment in the left navigation and select "Open Attribute Table".
Additional features
- To change the AOI outline, select the blue box underneath your
ProjectName_AOI. A panel on the right opens with options to replace the default blue outline. - To change the comment outline, select the blue box underneath your
CommentName. A panel on the right opens with options to replace the default blue outline. - The project must be reloaded to reflect any changes made in the UI. To reload a project, remove the project layer and reimport the project using the steps above.
Known Issues
- There are currently no exploit presets for Legion imagery.