Streaming - Buildings and Roads
Building and Road Change replaces the previous "CM EO" and "CM SAR" products which will be discontinued on December 11, 2026
Product Overview
Vantor Building and Road Change is a dataset that shows where change has been detected in buildings and roads. Change includes new development and major location or footprint modifications to existing infrastructure. Powered by deep learning models, Building and Road Change uses Copernicus Sentinel-2 imagery to regularly detect building and road change across the globe. Changes are updated monthly.
The dataset is exposed as both individual change detection polygons and a gridded density of change "heat map".
Change data is available over most of the global landmass (~ 100M sq km). Change detections have been generated from October 2023 to the present.
Features / Benefits
- Focus tasking and map maintenance activities with map-relevant building and road change data
- Support global missions with consistent change signals over population, transportation, and supply chain infrastructure
- Catch up on map updates with change detections from October 2023 to present
- Monitor change going forward with monthly change detections
Accuracy
Preliminary data shows building and road segmentation F1 scores of greater than 0.7 for buildings, and greater than 0.6 for roads.
Buildings and Roads Change OGC layers
Buildings and Roads Change is exposed through standard OGC WMS, WMTS, and WFS operations. Most requests use normal OGC operations and parameters. Date ranges and density zoom selection have the service-specific behavior described below.
Layers
Building and Road Change Density
Maxar:BuildingsAndRoadsChangeGeohash
Density overview for locating concentrations of change. This service displays grid cells that bin the number of changes over a time period. When displayed with a color ramp (the default style for WMS/WMTS), you get a "heat map" of areas that have had the most change. The time interval can also be changed, either showing all changes from October 2023, or more granular in 3-, 6-, 12-month intervals.
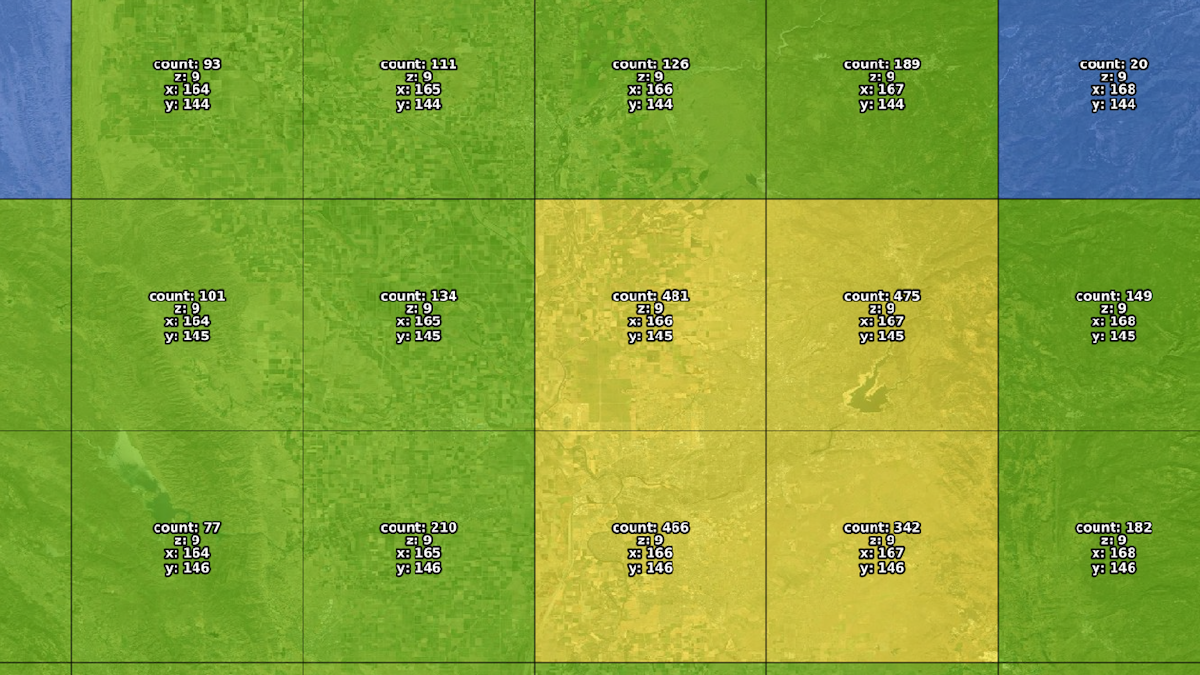
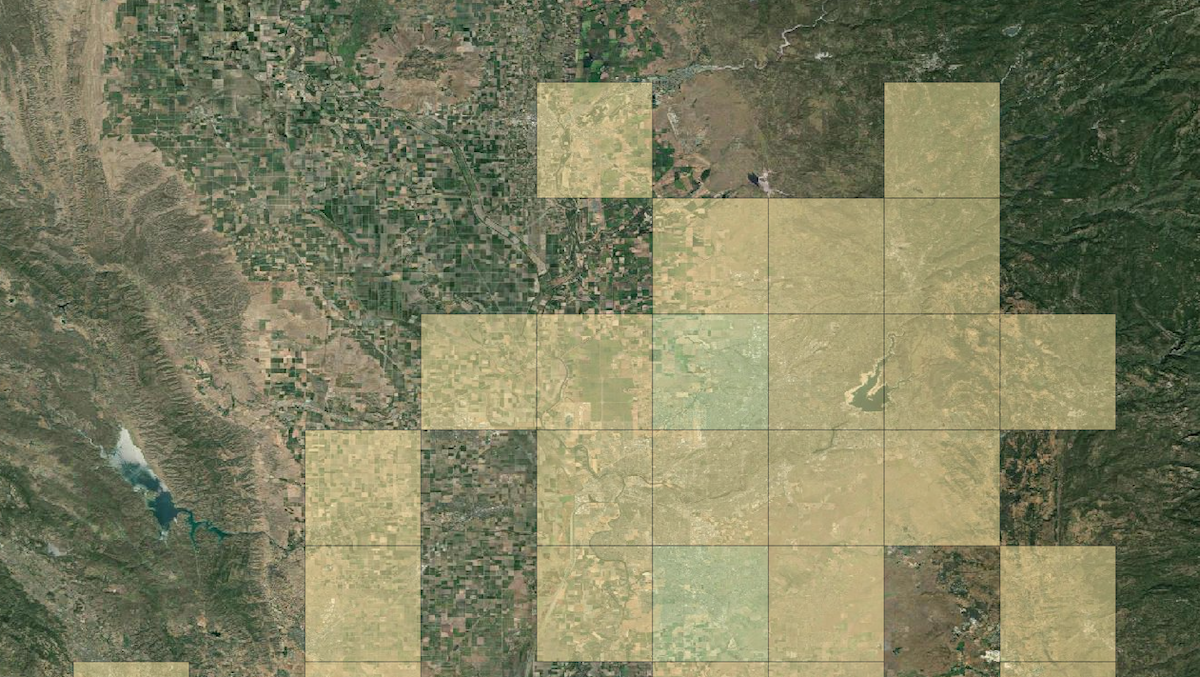
WMTS and WMS share the same color styling. WMTS tiles also include labels showing cell metadata.
Building and Road Change Polygons
Maxar:BuildingsAndRoadsChange
Individual building and road change detection polygons. These can be filtered to arbitrary time intervals.
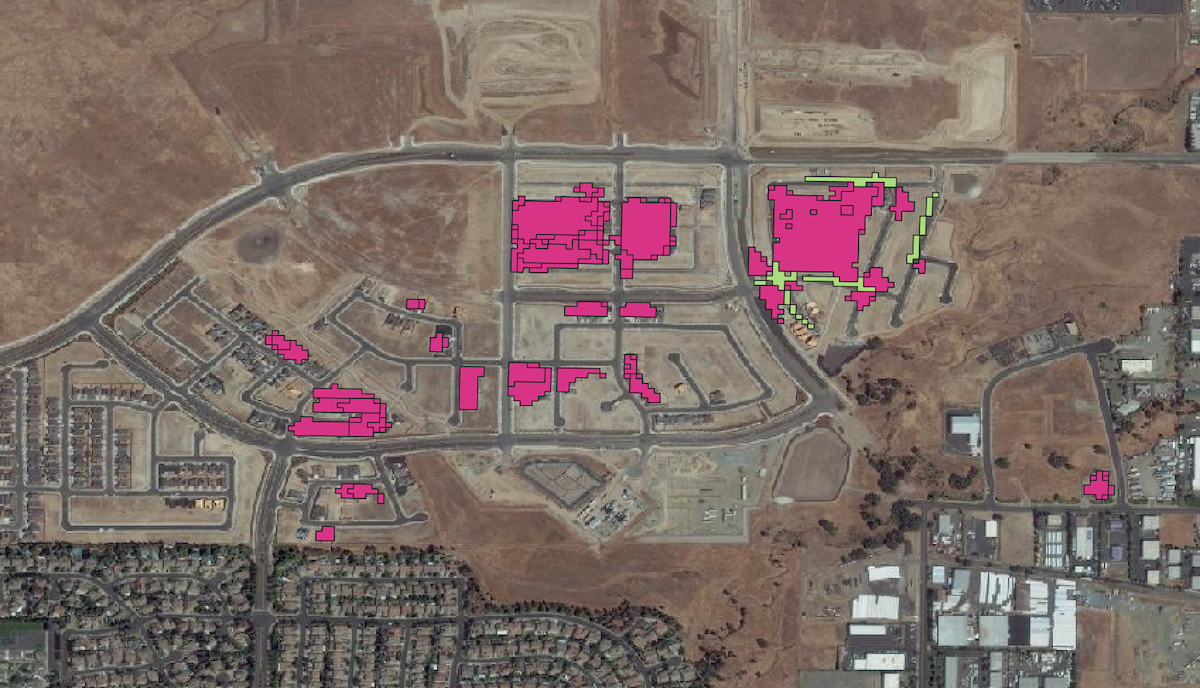
We recommend using the density layer at broader scales to see trends, then zooming in and switching to the polygon layer to inspect individual detections.
Working with dates
By default, if start or end dates are not requested, both layers show the 12 months preceding the date of the newest available detection, rather than the previous 12 months from today's date.
The fields dateFrom and dateTo can be used in a CQL filter to control the temporal range of the results, but their behavior is slightly different between the two layers.
For the detailed polygon layer, dateFrom and dateTo define the date range used to select the detection polygons. Results are inclusive of the dates. They can be used individually for open-ended ranges.
The density layer can show changes in four fixed time windows: the previous 3, 6, or 12 months, or all data from October 2023. Like the default 1-year display, the windows end on the most recent detection. You can select the window size by using the dateFrom parameter in a CQL filter. The system will select the appropriate window that best fits the start date. Dates 12 months older than the latest detection will always return all data. An exact date calculation is not required. The date provided only needs to fall inside the range.
When one of the 3-, 6-, or 12-month intervals is selected, the feature properties of each cell will include fields named dateFrom and dateTo that indicate the start and end dates of the interval used to calculate the feature counts. If you request all-time data using a dateFrom more than a year old, dateFrom or dateTo fields are not included in the feature properties.
dateTo is ignored for the density layer. The windows are always to the most recent detection. When an exact date range is needed, Use the detailed polygon layer and your own density analysis method.
Zoom and map scale
The density cell grid follows TMS tiling grid schemes, so the size of the cell grid is the same as the cells at the TMS "zoom" value. The cells are available in 4326 or 3857 tiling schemes.
It is possible to request grid cells at a specific zoom level size by filtering on the zoom property within a CQL filter like zoom=12. If not provided, the system selects an appropriate zoom level for the requested BBOX.
Querying a specific zoom level is primarily useful for WFS density requests. If not provided, you can receive overlapping features at different zoom levels as the BBOX changes size. This is especially noticeable when using a GIS client and is usually not the desired behavior.
Although a fixed zoom query can technically be supplied with density WMS and WMTS requests, it should not normally be forced. WMS already derives the appropriate grid level from BBOX, WIDTH, and HEIGHT. WMTS already supplies its zoom level through TILEMATRIX or the zoom parameter.
Retina and similar high-dpi displays can change the requested width, height, and bounding box for a cell and can cause slight visual differences in how the tiles are drawn. This may require some adjustment in how the tiles are rendered by your client.
Density currently supports zoom levels 5 through 18 for EPSG:4326 and 6 through 18 for EPSG:3857.
The detailed layer does not use the CQL zoom control. It returns data only when the requested map resolution is approximately 153 meters per pixel or finer, approximately map zoom 10 for an EPSG:4326 grid. This display threshold is separate from the density WFS aggregation-grid zoom. Because resolution varies with projection and latitude, it does not correspond to one universal web-map zoom level.
WFS feature descriptions
The standard WFS operation is DescribeFeatureType. It returns an XML Schema (XSD) describing the fields and data types available from GetFeature. Set TYPENAMES to either layer name. The response from DescribeFeatureType is the authoritative schema because detailed attributes may evolve over time.
Maxar:BuildingsAndRoadsChange schema:
| Name | Type | Description |
|---|---|---|
| featureId | xsd:string | Detection identifier |
| featureGeometry | gml:GeometryPropertyType | Detection geometry |
| confidence | xsd:double | Detection confidence |
| feature_type | xsd:string | "building" or "road" |
| change_status | xsd:string | Change status |
| change_date | xsd:dateTime | Change date and time |
| area_sqkm | xsd:double | Area in square kilometers |
| image_id | xsd:string | Source image identifier |
Maxar:BuildingsAndRoadsChangeGeohash schema:
| Name | Type | Description |
|---|---|---|
| tileX | xsd:int | Density-cell column |
| tileY | xsd:int | Density-cell row |
| zoom | xsd:int | Aggregation-grid zoom |
| featureCount | xsd:long | Detections in the cell |
| changeCountClass | xsd:int | Density display class (can be used to select a cell color) |
| geometry | gml:GeometryPropertyType | Density-cell boundary |
when querying with dateFrom only | ||
| dateFrom | xsd:string | Applied period start |
| dateTo | xsd:string | Applied period end |
As described above, in density results the fields dateFrom and dateTo describe the applied rolling period used to calculate the feature count. Using dateFrom in a CQL filter does not directly filter the dateFrom field, since these values are determined dynamically to best match the intent of your query. The dateFrom date in a CQL filter will most likely not match the dateFrom values.
changeCountClass contains 7 classes (equal interval, values 0-6) used to style the data in WMS requests. You can use this class to style WFS results to match.
URL examples
The Building and Road Change layers are served from the same server that streams imagery. Requests require the same authorization methods.
Base WMS and WFS endpoint
https://api.maxar.com/streaming/v1/ogc/ows?
Valid WMTS endpoints
https://api.maxar.com/streaming/v1/ogc/gwc/service/wmts?https://api.maxar.com/streaming/v1/ogc/wmts?
The shorter endpoint is an alias for the full GeoWebCache WMTS endpoint.
WMS examples
Get WMS capabilities
- Readable
- Pastable
https://api.maxar.com/streaming/v1/ogc/ows?
SERVICE=WMS
&REQUEST=GetCapabilities
https://api.maxar.com/streaming/v1/ogc/ows?SERVICE=WMS&REQUEST=GetCapabilities
Display detailed detections for an exact date range.
CQL_FILTER: dateFrom >= '2026-01-01' AND dateTo <= '2026-10-31'
- Readable
- Pastable
https://api.maxar.com/streaming/v1/ogc/ows?
SERVICE=WMS
&VERSION=1.1.1
&REQUEST=GetMap
&LAYERS=Maxar:BuildingsAndRoadsChange
&FORMAT=image/png
&TRANSPARENT=true
&SRS=EPSG:4326
&WIDTH=256
&HEIGHT=256
&BBOX=-118.30078125,33.94335995,-118.12500000,34.08906132
&CQL_FILTER=dateFrom >= '2026-01-01' AND dateTo <= '2026-10-31'`
https://api.maxar.com/streaming/v1/ogc/ows?SERVICE=WMS&VERSION=1.1.1&REQUEST=GetMap&LAYERS=Maxar%3ABuildingsAndRoadsChange&STYLES=&FORMAT=image%2Fpng&TRANSPARENT=true&SRS=EPSG%3A4326&WIDTH=256&HEIGHT=256&BBOX=-118.30078125,33.94335995,-118.12500000,34.08906132&CQL_FILTER=dateFrom%20%3E%3D%20%272026-01-01%27%20AND%20dateTo%20%3C%3D%20%272026-10-31%27
Display density for a rolling date period
The density layer ignores dateTo.
CQL_FILTER: dateFrom >= '2026-08-01'
- Readable
- Pastable
https://api.maxar.com/streaming/v1/ogc/ows?
SERVICE=WMS
&VERSION=1.1.1
&REQUEST=GetMap
&LAYERS=Maxar:BuildingsAndRoadsChangeGeohash
&FORMAT=image/png
&TRANSPARENT=true
&SRS=EPSG:4326
&WIDTH=256
&HEIGHT=256
&BBOX=-118.30078125,33.94335995,-118.12500000,34.08906132
&CQL_FILTER=dateFrom >= '2026-08-01'
https://api.maxar.com/streaming/v1/ogc/ows?SERVICE=WMS&VERSION=1.1.1&REQUEST=GetMap&LAYERS=Maxar%3ABuildingsAndRoadsChangeGeohash&STYLES=&FORMAT=image%2Fpng&TRANSPARENT=true&SRS=EPSG%3A4326&WIDTH=256&HEIGHT=256&BBOX=-118.30078125,33.94335995,-118.12500000,34.08906132&CQL_FILTER=dateFrom%20%3E%3D%20%272026-08-01%27
WFS examples
Get WMF capabilities
- Readable
- Pastable
https://api.maxar.com/streaming/v1/ogc/ows?
SERVICE=WMS
&REQUEST=GetCapabilities
https://api.maxar.com/streaming/v1/ogc/ows?SERVICE=WMS&REQUEST=GetCapabilities
Describe the detailed schemas
- Readable
- Pastable
https://api.maxar.com/streaming/v1/ogc/ows?
SERVICE=WFS
&VERSION=2.0.0
&REQUEST=DescribeFeatureType
&TYPENAMES=Maxar:BuildingsAndRoadsChange,Maxar:BuildingsAndRoadsChangeGeohash
https://api.maxar.com/streaming/v1/ogc/ows?SERVICE=WFS&VERSION=2.0.0&REQUEST=DescribeFeatureType&TYPENAMES=Maxar%3ABuildingsAndRoadsChange,Maxar%3ABuildingsAndRoadsChangeGeohash
Retrieve detailed detections for an exact date range as GeoJSON
CQL_FILTER: dateFrom >= '2026-01-01' AND dateTo <= '2026-10-31'
- Readable
- Pastable
https://api.maxar.com/streaming/v1/ogc/ows?
SERVICE=WFS
&VERSION=2.0.0
&REQUEST=GetFeature
&TYPENAMES=Maxar:BuildingsAndRoadsChange
&OUTPUTFORMAT=application/json
&COUNT=100
&SRSNAME=EPSG:4326
&BBOX=-118.30078125,33.94335995,-118.12500000,34.08906132,EPSG:4326
&CQL_FILTER= dateFrom >= '2026-01-01' AND dateTo <= '2026-10-31'
https://api.maxar.com/streaming/v1/ogc/ows?SERVICE=WFS&VERSION=2.0.0&REQUEST=GetFeature&TYPENAMES=Maxar%3ABuildingsAndRoadsChange&OUTPUTFORMAT=application%2Fjson&COUNT=100&SRSNAME=EPSG%3A4326&BBOX=-118.30078125,33.94335995,-118.12500000,34.08906132,EPSG%3A4326&CQL_FILTER=dateFrom%20%3E%3D%20%272026-01-01%27%20AND%20dateTo%20%3C%3D%20%272026-10-31%27
Retrieve only road detections
CQL_FILTER: feature_type = 'road'
- Readable
- Pastable
https://api.maxar.com/streaming/v1/ogc/ows?
SERVICE=WFS
&VERSION=2.0.0
&REQUEST=GetFeature
&TYPENAMES=Maxar:BuildingsAndRoadsChange
&OUTPUTFORMAT=application/json
&COUNT=100
&SRSNAME=EPSG%3A4326
&BBOX=-118.30078125,33.94335995,-118.12500000,34.08906132,EPSG:4326
&CQL_FILTER= feature_type = 'road'
https://api.maxar.com/streaming/v1/ogc/ows?SERVICE=WFS&VERSION=2.0.0&REQUEST=GetFeature&TYPENAMES=Maxar%3ABuildingsAndRoadsChange&OUTPUTFORMAT=application%2Fjson&COUNT=100&SRSNAME=EPSG%3A4326&BBOX=-118.30078125,33.94335995,-118.12500000,34.08906132,EPSG%3A4326&CQL_FILTER=feature_type%20%3D%20%27road%27
Retrieve density cells for a rolling date period
Note: Since the zoom level is not explicitly queried, the service picks an appropriate grid size from the BBOX. Most WFS use cases will not want this behavior unless each request's results are used in isolation.
CQL_FILTER: dateFrom >= '2026-08-01'
- Readable
- Pastable
https://api.maxar.com/streaming/v1/ogc/ows?
SERVICE=WFS
&VERSION=2.0.0
&REQUEST=GetFeature
&TYPENAMES=Maxar:BuildingsAndRoadsChangeGeohash
&OUTPUTFORMAT=application/json
&COUNT=100
&SRSNAME=EPSG:4326
&BBOX=-118.30078125,33.94335995,-118.12500000,34.08906132,EPSG:4326
CQL_FILTER= dateFrom >= '2026-08-01'
https://api.maxar.com/streaming/v1/ogc/ows?SERVICE=WFS&VERSION=2.0.0&REQUEST=GetFeature&TYPENAMES=Maxar%3ABuildingsAndRoadsChangeGeohash&OUTPUTFORMAT=application%2Fjson&COUNT=100&SRSNAME=EPSG%3A4326&BBOX=-118.30078125,33.94335995,-118.12500000,34.08906132,EPSG%3A4326&CQL_FILTER=dateFrom%20%3E%3D%20%272026-08-01%27
Retrieve density cells at aggregation-grid zoom 12. This is recommended when using WFS as a layer source where multiple requests are combined and stored.
CQL_FILTER: zoom = 12
- Readable
- Pastable
https://api.maxar.com/streaming/v1/ogc/ows?
SERVICE=WFS
&VERSION=2.0.0
&REQUEST=GetFeature
&TYPENAMES=Maxar:BuildingsAndRoadsChangeGeohash
&OUTPUTFORMAT=application/json
&COUNT=100
&SRSNAME=EPSG:4326
&BBOX=-118.30078125,33.94335995,-118.12500000,34.08906132,EPSG%3A4326
&CQL_FILTER= zoom = 12
https://api.maxar.com/streaming/v1/ogc/ows?SERVICE=WFS&VERSION=2.0.0&REQUEST=GetFeature&TYPENAMES=Maxar%3ABuildingsAndRoadsChangeGeohash&OUTPUTFORMAT=application%2Fjson&COUNT=100&SRSNAME=EPSG%3A4326&BBOX=-118.30078125,33.94335995,-118.12500000,34.08906132,EPSG%3A4326&CQL_FILTER=zoom%20%3D%2012
WFS Pagination Details
WFS returns one page of features per GetFeature request. Unlike WMS, it does not automatically combine pages for the client. The service returns at most 5,000 features per request, even if a larger page is requested.
For WFS 2.0.0, COUNT sets the page size and STARTINDEX sets the zero-based position of the first feature:
COUNT=100&STARTINDEX=0 COUNT=100&STARTINDEX=100
For WFS 1.0.0 and 1.1.0, use MAXFEATURES instead of COUNT. This service also accepts STARTINDEX for those versions as a GeoServer extension:
MAXFEATURES=100&STARTINDEX=0 MAXFEATURES=100&STARTINDEX=100
Keep BBOX, CQL_FILTER, and other selection parameters unchanged between pages. Continue increasing STARTINDEX until a response contains fewer features than requested. OFFSET is not a public WFS parameter and should not be used.
WMTS examples
Get WMTS capabilities
- Readable
- Pastable
https://api.maxar.com/streaming/v1/ogc/gwc/service/wmts?
SERVICE=WMTS
&REQUEST=GetCapabilities
https://api.maxar.com/streaming/v1/ogc/gwc/service/wmts?SERVICE=WMTS&REQUEST=GetCapabilities
Retrieve a detailed tile containing road detections
CQL_FILTER: feature_type = 'road'
- Readable
- Pastable
https://api.maxar.com/streaming/v1/ogc/gwc/service/wmts?
SERVICE=WMTS
&REQUEST=GetTile
&VERSION=1.0.0
&LAYER=Maxar:BuildingsAndRoadsChange
&STYLE=Maxar:BuildingsAndRoadsChange
&FORMAT=image/png
&TILEMATRIXSET=EPSG:3857
&TILEMATRIX=EPSG:3857:17
&TILEROW=52365
&TILECOL=22524
&CQL_FILTER= feature_type = 'road'
<Tabs>
https://api.maxar.com/streaming/v1/ogc/gwc/service/wmts?SERVICE=WMTS&REQUEST=GetTile&VERSION=1.0.0&LAYER=Maxar%3ABuildingsAndRoadsChange&STYLE=Maxar%3ABuildingsAndRoadsChange&FORMAT=image%2Fpng&TILEMATRIXSET=EPSG%3A3857&TILEMATRIX=EPSG%3A3857%3A17&TILEROW=52365&TILECOL=22524&CQL_FILTER=feature_type%20%3D%20%27road%27
Retrieve a density tile for a rolling date period.
CQL_FILTER: dateFrom >= '2026-08-01'
- Readable
- Pastable
https://api.maxar.com/streaming/v1/ogc/gwc/service/wmts?
SERVICE=WMTS
&REQUEST=GetTile
&VERSION=1.0.0
&LAYER=Maxar:BuildingsAndRoadsChangeGeohash
&STYLE=Maxar:BuildingsAndRoadsChangeGeohash
&FORMAT=image/png
&TILEMATRIXSET=EPSG:3857
&TILEMATRIX=EPSG:3857:9
&TILEROW=275
&TILECOL=177
&CQL_FILTER= dateFrom >= '2026-08-01'
https://api.maxar.com/streaming/v1/ogc/gwc/service/wmts?SERVICE=WMTS&REQUEST=GetTile&VERSION=1.0.0&LAYER=Maxar%3ABuildingsAndRoadsChangeGeohash&STYLE=Maxar%3ABuildingsAndRoadsChangeGeohash&FORMAT=image%2Fpng&TILEMATRIXSET=EPSG%3A3857&TILEMATRIX=EPSG%3A3857%3A9&TILEROW=275&TILECOL=177&CQL_FILTER=dateFrom%20%3E%3D%20%272026-08-01%27
WMTS uses TILEMATRIX as part of standard tile addressing. Although a zoom CQL predicate can be supplied, it should normally be omitted because TILEMATRIX already identifies the zoom level. The grid cell drawn has the same boundaries as the requested WMTS tile.